Raken helps customers manage performance at both the project and company level.
This quick guide will show you how to use our dashboards to gain actionable insights from your collected data.
About Raken dashboards
Our web app features multiple dashboard views that automatically organize the information your team inputs through daily reports, checklists, and other Raken solutions.
You can use our dashboards to:
Track production by project or by all projects
Measure project progress against estimates
Analyze safety and quality trends
Monitor—and incentivize—compliance
Your main dashboard
When you first log into our web app, you’ll see your main dashboard view. At any time, you can access your main dashboard from the Dashboard tab in the menu in the top center of your screen.
The main dashboard collects data from all your projects. There are four sections, organized by tabs labeled Activity, Reports, Insights, and Live Views.
Activity
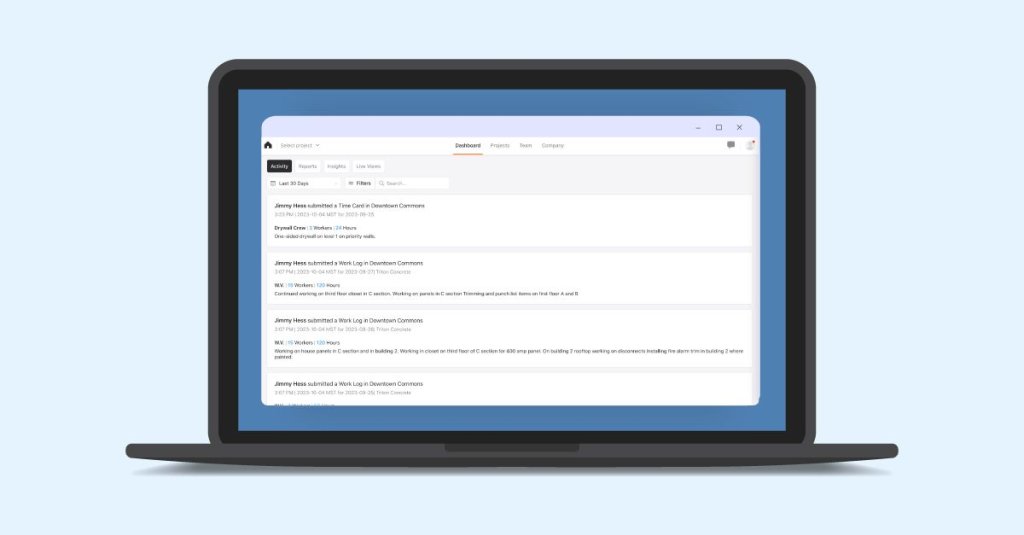
Here you can track all activity such as work and equipment logs, time cards, and attachments submitted on the company level. Use this tab as an overview of project progress. You can see exactly what’s happening on each jobsite without having to access each individual project.
Filter results by date, project, and team member.
Reports
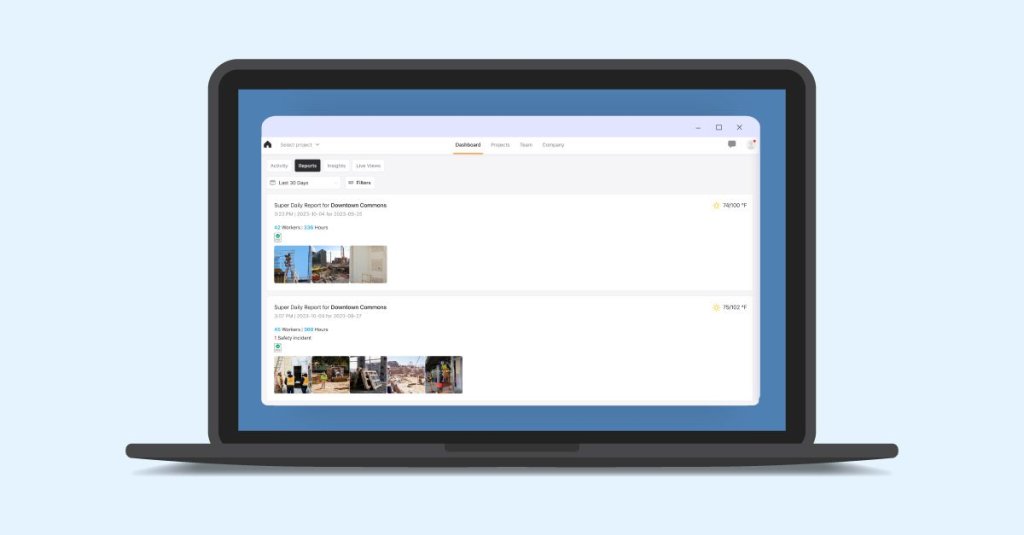
The Reports section is a feed of all your completed reports for every project. View, download, and share signed PDF copies.
Insights
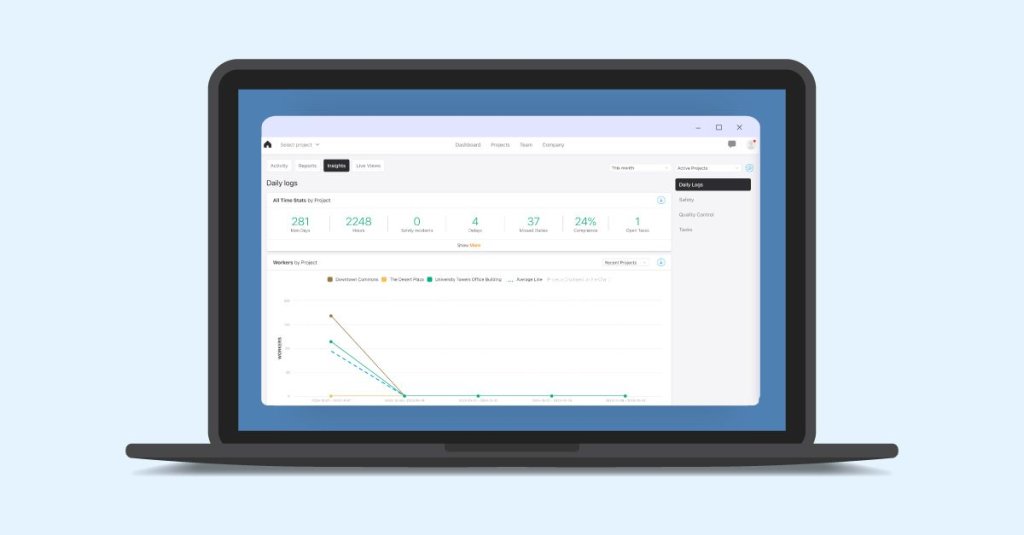
This is the most detailed section of the main dashboard. Scroll through the Insights tab to find performance data visually organized into easy-to-understand charts and graphs.
There are sections for:
Time Stats - An overview of work hours, delays, safety incidents, and report compliance
Workers - A chart showing how many workers are currently assigned to each project
Top Users - Stats on how your team members are using Raken
Compliance by Subcontractor - Stats for subcontractor reporting compliance
Hours by Project - A chart showing how many work hours were spent on each project
Compliance by Project - A chart showing report compliance by project
Project Delays - A breakdown of delays by date and project
Safety Incidents - A breakdown of safety incidents by date and project
Reviewing the Insights tab is a great way to analyze strengths and identify areas for improvement.
Quickly see which projects are performing well and which are taking up a significant amount of time and resources. And, monitor reporting compliance to take action if a team member or subcontractor isn’t meeting requirements—or potentially reward top users who never miss a daily with an incentive program.
You can also download a report from the Insights tab that can be shared with stakeholders.
Live View
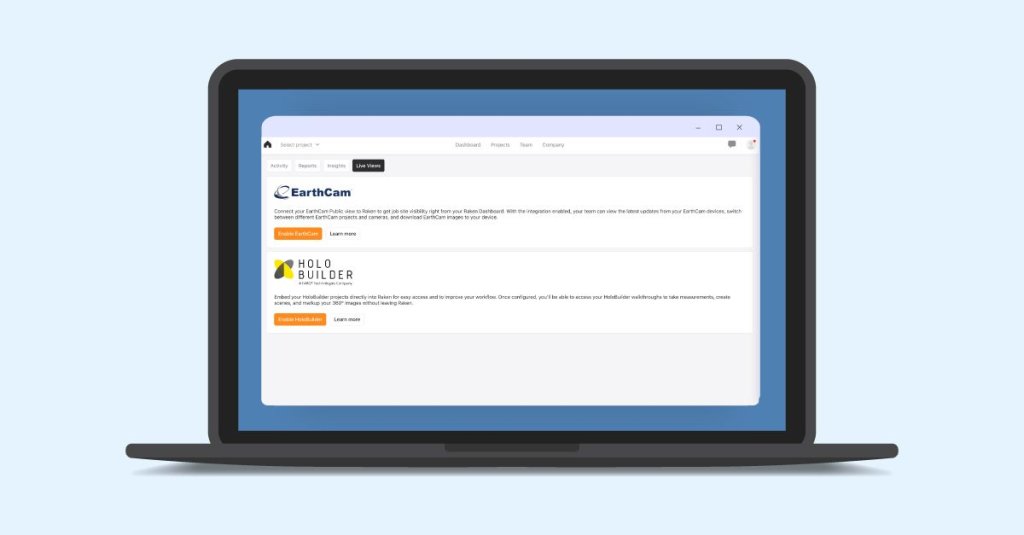
If you’ve integrated Raken with HoloBuilder360° or EarthCam, visit the Live View tab to see a webcam feed or live photos from your jobsites.
Read our dashboard support article.
Project-level dashboards
There are several additional dashboard views available for each individual project.
Project dashboard
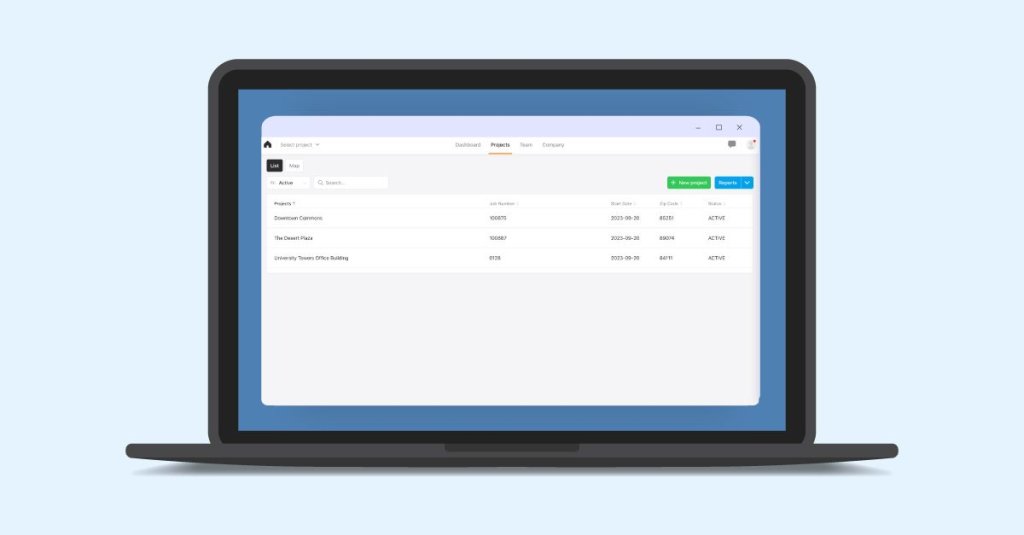
Accessing a project in the Raken web app and choosing the Dashboard option from the left sidebar will take you to the project’s individual dashboard.
Here, you can find tabs for Activity, Insights, and Live Views using only data from that project.
The Insights tab for each project dashboard will also include a section listing open tasks.
Production insights
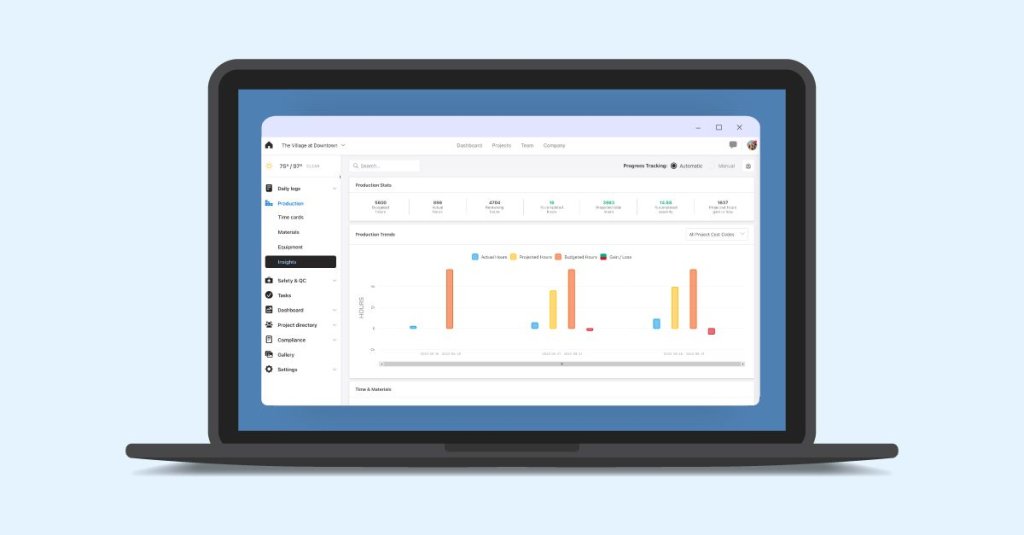
For a more detailed look at project performance, choose the Production option from the left sidebar within a project. Then, select Insights from the drop down menu. This is your production insights dashboard.
There are three sections:
Production stats - An overview of estimated budget and schedule vs. actuals, including projected performance
Production trends - A chart showing a visual representation of performance data
Time & materials - A breakdown of how resources are utilized by cost code
You’ll have these insights available in real time, updated instantly whenever your field crew submits new data. Review the production insights dashboard frequently during the course of a project to catch developing issues and quickly correct course or adjust the budget and schedule as needed.
The production insights dashboard is also a valuable tool for measuring a project's success.
Learn how to set up production insights.
Safety & quality
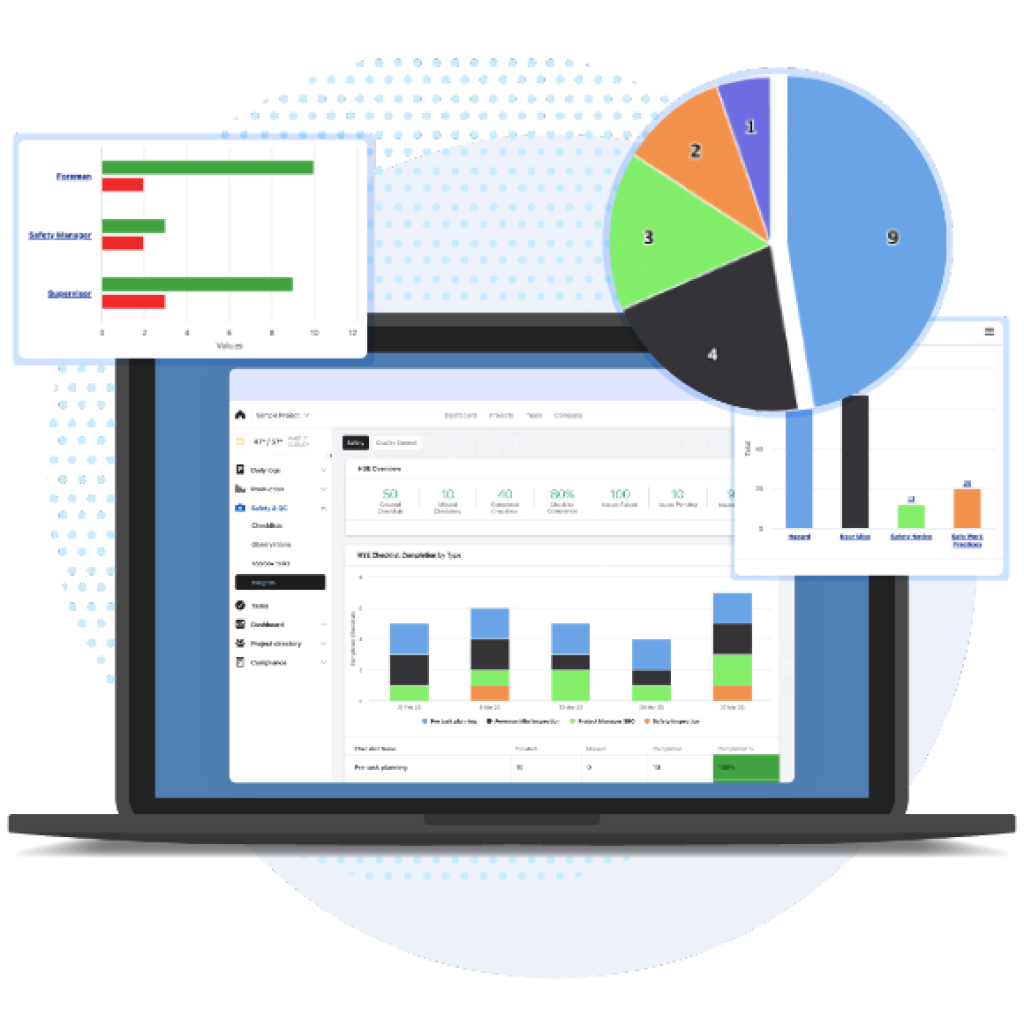
Choose the Safety & QC option from the left sidebar within a project and select Insights from the drop down menu to access the safety and quality dashboard. This dashboard organizes safety and quality data from observations and checklists to help you analyze trends and identify common issues.
The safety and quality dashboard has two subsections which you can access using the Safety and Quality Control tabs at the top of the dashboard.
Safety
The safety section features:
HSE overview
HSE checklist completion
HSE checklist completion by work unit
Top 5 checklist deficiencies
HSE issues raised by type
HSE observations raised by team member
HSE issues observed/hours worked
Positive vs. negative HSE observations by company
Toolbox Talks
Quality Control
The quality control section features:
Quality overview
Quality checklist completion
Quality checklist completion by work unit
Top 5 checklist deficiencies
Quality issues raised by type
Quality observations raised by team member
Quality issues observed / hours worked
Positive vs. negative quality observations by company
Use this safety and quality data to help prevent future incidents and implement effective risk management plans. You’ll know where your team struggles and succeeds, and can reward positive behavior and develop strategies to combat any weak areas.
Read about our safety and quality reporting tools.
Some features may not be available with your plan—check with our customer success team for more details.
New to Raken?
Contact our sales team or schedule a personalized demo to see our field management solutions in action.